The Top 9 teams remain unchanged, as the Cowboys increased their small lead over the Steelers to 6 points, 108-102. Then, there is a giant gap before #3 San Francisco at 85 points, Oakland at 77, and then another large gap to #5 New England.
At the very bottom remains the Houston Texans who have never made the playoffs - therefore they have 0 points. But, since they are an expansion team, we should point out that the worst teams in the franchise rankings are actually the Lions with 11 points, and the Cardinals with 10.
So, what are these rankings all about? Here is what I wrote last year:
To recap, a few years ago, a good strong listener asked me to rank the franchises from #32 to #1 based on their accomplishments from Super Bowl I to present.
So I did. I wanted it to be objective, not subjective. I wanted it to be a formula and you would just enter the numbers and it would spit out the rankings with no favoritism or prejudice. We have been doing this since 2001. Since then, it has been imitated a time or two , but I don’t mind. It is pretty obvious idea for any sports nerd to come up with.
Here is how it works. Each Franchise gets 1 point for each season it makes the playoffs. Then, if it reaches the Conference Championship Game it gets a total of 3 points. If it makes the Super Bowl it gets 5, and if it wins the Super Bowl it wins the maximum total of points in a given year of 11. It used to be 10 for the Super Bowl, but I have adjusted it this year because I didn’t like the idea that 2 Super Bowl losses equaled a Super Bowl win. So, Now 11 points for a win and 5 for a loss in the Super Bowl.
I have been asked why no points are given for wins in the Wildcard round, but I decided that would not make sense with the idea that the playoffs have grown over the years and there is no way to equalize a smaller field to a larger one. Also, a Wildcard win is not that big a deal anymore with 6 teams in the playoffs, so unless you reach the Conference Title game, no additional points beyond the 1 for making the post-season.
I also have been asked how come I don’t go by average points per season (since many teams have joined the league since Super Bowl 1. My answer is simple: I don’t want to penalize teams who have been in the league all of the years. If you go by average points per year rather than total points, it is possible that the Baltimore Ravens would have been #1 if they had won the Super Bowl this year. No chance I would believe that premise, given that they didn’t exist prior to 1996. But, if a team has been established since the season of Super Bowl 1 (1966), it is notated.
Just add up the points for all the years, and that is the entire formula.
Otherwise, I break ties based on the team with more Super Bowl wins, then Super Bowl losses, then Championship Game wins, etc. There are no ties. I will settle it somehow.
I have decided to add the category this year in version 9.0 that many have requested - average pts per year - so that we may determine results based on years in the league. 24 of the 32 teams have been here the entire span of the 44 years of Super Bowl football, but this metric will help put the other 8 teams: Saints '67, Bengals '68, Seahawks '76, Buccaneers '76, Jaguars '95, Panthers '95, Ravens '96, and Texans '02. Also, the Browns missed 96-98, so they only have 41 seasons to work with.
So, let's check the Feb 2010 update:
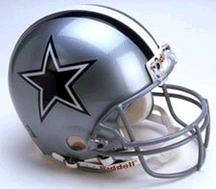
#1 - Dallas Cowboys (Last Year, #1)
Total Points: 108
Total Playoff Years: 66C, 67C, 68, 69, 70SL, 71S, 72C, 73C, 75SL, 76, 77S, 78SL, 79, 80C, 81C, 82C, 83, 85, 91, 92S, 93S, 94C, 95S, 96, 98, 99, 03, 06, 07, 09
P: 30
4: 8
2: 3
1: 5
Average: 2.45 points per season

#2 - Pittburgh Steelers (#2)
Total Points: 102
Total Playoff Years: 72C, 73, 74S, 75S, 76C, 77, 78S, 79S, 82, 83, 84C, 89, 92, 93, 94C, 95SL, 96, 97C, 01C, 02, 04C, 05S, 07, 08S
P: 24
4: 7
2: 1
1: 6
Average: 2.31 per season

#3 - San Francisco 49ers (#3)
Total Points: 85
Total Playoff Years: 70C, 71C, 72, 81S, 83C, 84S, 85, 86, 87, 88S, 89S, 90C, 92C, 93C, 94S, 95, 96, 97C, 98, 01, 02
P: 21
4: 7
2: 0
1: 5
Average: 1.93
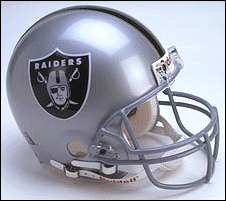
#4 - Oakland Raiders (#4)
Total Points: 77
Total Playoff Years: 67SL, 68C, 69C, 70C, 72, 73C, 74C, 75C, 76S, 77C, 80S, 82, 83S, 84, 85, 90C, 91, 93, 00C, 01, 02SL
P: 21
4: 9
2: 2
1: 3
Average: 1.75

#5 - New England Patriots (#5)
Total Points: 60
Total Playoff Years: 76, 78, 82, 85SL, 86, 94, 96SL, 97, 98, 01S, 03S, 04S, 05, 06C, 07SL, 09
P: 16
4: 1
2: 3
1: 3
Average: 1.36

#6 - Miami Dolphins (#6)
Total Points: 58
Total Playoff Years: 70, 71SL, 72S, 73S, 74, 78, 79, 81, 82SL, 83, 84SL, 85C, 90, 92C, 94, 95, 97, 98, 99, 00, 01, 08
P: 22
4: 2
2: 3
1: 2
Average: 1.32

# 7 - Denver Broncos (#7)
Total Points: 57
Total Playoff Years: 77SL, 78, 79, 83, 84, 86SL, 87SL, 89SL, 91C, 93, 96, 97S, 98S, 00, 03, 04, 05C
P: 17
4: 2
2: 4
1: 2
Average: 1.29
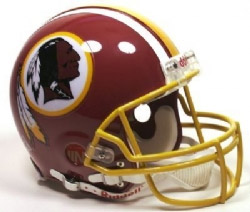
#8 - Washington Redskins (#8)
Total Points: 56
Total Playoff Years: 71, 72SL, 73, 74, 76, 82S, 83SL, 84, 86C, 87S, 90, 91S, 92, 99, 05, 07
P: 16
4: 1
2: 2
1: 3
Average: 1.27
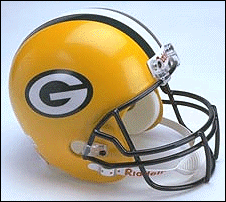
#9 - Green Bay Packers (#9)
Total Points: 54
Total Playoff Years: 66S, 67S, 72, 82, 93, 94, 95C, 96S, 97SL, 98, 01, 02, 03, 04, 07C, 09
P: 16
4: 2
2: 1
1: 3
Average: 1.23
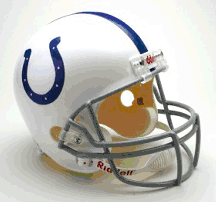
#10 - Indianapolis/Baltimore Colts (#13)
Total Points: 53
Total Playoff Years: 68SL, 70S, 71C, 75, 76, 77, 87, 95C, 96, 99, 00, 02, 03C, 04, 05, 06S, 07, 08, 09SL
P: 19
4: 3
2: 2
1: 2
Average: 1.20

#11 - Minnesota Vikings (#11)
Total Points: 52
Total Playoff Years: 68, 69SL, 70, 71, 73SL, 74SL, 75, 76SL, 77C, 78, 80, 82, 87C, 88, 89, 92, 93, 94, 96, 97, 98C, 99, 00C, 04, 08, 09C
P: 26
4: 5
2: 4
1: 0
Average: 1.18
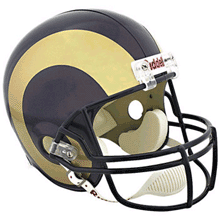
#12 - St Louis/Los Angeles Rams (#10)
Total Points: 51
Total Playoff Years: 67, 69, 73, 74C, 75C, 76C, 77, 78C, 79SL, 80, 83, 84, 85C, 86, 88, 89C, 99S, 00, 01SL, 03, 04
P: 21
4: 6
2: 2
1: 1
Average: 1.16

#13 - New York Giants (#12)
Total Points: 48
Total Playoff Years: 81, 84, 85, 86S, 89, 90S, 93, 97, 00SL, 02, 05, 06, 07S, 08
P: 14
4: 0
2: 1
1: 3
Average: 1.09

#14 - Buffalo Bills (#14)
Total Points: 34
Total Playoff Years: 66C, 74, 80, 81, 88C, 89, 90SL, 91SL, 92SL, 93SL, 95, 96, 98, 99
P: 14
4: 2
2: 4
1: 0
Average: 0.77
Note: Bills have Super Bowl tie breaker on Eagles, 4-2.

#15 - Philadelphia Eagles (#15)
Total Points: 34
Total Playoff Years: 78, 79, 80SL, 81, 88, 89, 90, 92, 95, 96, 00, 01C, 02C, 03C, 04SL, 06, 08C, 09
P: 18
4: 4
2: 2
1: 0
Average: 0.77
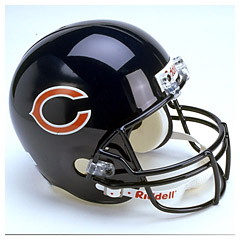
#16 - Chicago Bears (#16)
Total Points: 31
Total Playoff Years: 77, 79, 84C, 85S, 86, 87, 88C, 90, 91, 94, 01, 05, 06SL
P: 13
4: 2
2: 1
1: 1
Average: 0.70

#17 - Kansas City Chiefs (#17)
Total Points: 30
Total Playoff Years: 66SL, 68, 69S, 71, 86, 90, 91, 92, 93C, 94, 95, 97, 03, 06
P: 14
4: 1
2: 1
1: 1
Average: 0.68
Note: Chiefs have tie-breaker on Titans with the Lombardi Trophy edge, 1-0.

#18 - Tennessee Titans/Houston Oilers (#18)
Total Points: 30
Total Playoff Years: 67C, 69, 78C, 79C, 80, 87, 88, 89, 90, 91, 92, 93, 99SL, 00, 02C, 03, 07, 08
P: 18
4: 4
2: 1
1: 0
Average: 0.68

#19 - New York Jets (#19)
Total Points: 29
Total Playoff Years: 68S, 69, 81, 82C, 85, 86, 91, 98C, 01, 02, 04, 06, 09C
P: 13
4: 3
2: 0
1: 1
Average: 0.66

#20 - Tampa Bay Buccaneers (#20)
Established 1976
Total Points: 24
Total Playoff Years: 79C, 81, 82, 97, 99C, 00, 01, 02S, 05, 07
P: 10
4: 2
2: 0
1: 1
Average: 0.70
Note: Bucs win tiebreak on Browns with Lombardi Trophy, 1-0.

#21 - Cleveland Browns (#21)
Total Points: 24
Total Playoff Years: 67, 68C, 69C, 71, 72, 80, 82, 85, 86C, 87C, 88, 89C, 94, 02
P: 14
4: 5
2: 0
1: 0
Average: 0.54

#22 - San Diego Chargers (#22)
Total Points: 22
Total Playoff Years: 79, 80C, 81C, 82, 92, 94SL, 95, 04, 06, 07C, 08, 09
P: 12
4: 3
2: 1
1: 0
Average: 0.50

#23 – New Orleans Saints (#31)
Established 1967
Total Points: 19
Total Playoff Years: 87, 90, 91, 92, 00, 06C, 09S
P: 7
4: 1
2: 0
1: 1
Average: 0.44
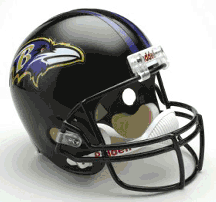
#24 – Baltimore Ravens (#23)
Established 1996
Total Points: 18
Total Playoff Years: 00S, 01, 03, 06, 08C, 09
P: 6
4: 1
2: 0
1: 1
Average: 1.29

#25 - Cincinnati Bengals (#24)
Established 1968
Total Points: 17
Total Playoff Years: 70, 73, 75, 81SL, 82, 88SL, 90, 05, 09
P: 9
4: 0
2: 2
1: 0
Average: 0.40

#26 - Seattle Seahawks (#25)
Established 1976
Total Points: 16
Total Playoff Years: 83C, 84, 87, 88, 99, 03, 04, 05SL, 06, 07
P: 10
4: 1
2: 1
1: 0
Average: 0.47

#27 – Atlanta Falcons (#26)
Total Points: 15
Total Playoff Years: 78, 80, 82, 91, 95, 98SL, 02, 04C, 08
P: 9
4: 1
2: 1
1: 0
Average: 0.34

#28 - Carolina Panthers (#27)
Established 1995
Total Points: 12
Total Playoff Years: 96C, 03SL, 05C, 08
P: 4
4: 2
2: 1
1: 0
Average: 0.80

#29 - Detroit Lions (#28)
Total Points: 11
Total Playoff Years: 70, 82, 83, 91C, 93, 94, 95, 97, 99
P: 9
4: 1
2: 0
1: 0
Average: 0.25

#30 – Arizona/St Louis Cardinals (#30)
Total Points: 10
Total Playoff Years: 74, 75, 82, 98, 08SL, 09
P: 6
4: 0
2: 1
1: 0
Average: 0.23

#31 – Jacksonville Jaguars (#29)
Established 1995
Total Points: 10
Total Playoff Years: 96C, 97, 98, 99C, 05, 07
P: 6
4: 2
2: 0
1: 0
Average: 0.66

#32 – Houston Texans (32)
Established 2002
Total Points: 0
Total Playoff Years: None
P: 0
4: 0
2: 0
1: 0
Average: 0.00
Explanation of Years:
Just the year means they made the playoffs (1 point). Year followed by “C” means they lost in the Conference Championship Game (3 points), Year followed by “SL” means they lost the Super Bowl (5 points), and Year followed by “S” means they won the Super Bowl (11 points).
Version 8.0
Version 7.0 …
Version 6.0 …
What would the rankings be over the past 10 years? 20 years? I bet the Cowboys don't fare so well.
ReplyDeletewow, critical thinking there buddy
ReplyDeleteJust nit picking here, but you need to update some of the helmets. SD, SF, Jax, and Det come to mind. Otherwise, great stuff, Sturminator.
ReplyDeleteThe other side of Lefty astute comment is this: what did the standings look like right after the Cowboys won Super Bowl XXX? Dallas would have had 101 points in thirty seasons which comes to a remarkable 3.37 points per year. That means that through 1995, a trip to the Conference finals constituted a sub-par year. Of course they've slipped off that pace a bit since then.
ReplyDeleteyoure an idiot "Lefty". Maybe over 10 years they wont fare so well, but just like people who conveniently take quote out of context, anyone can just pick a random moment in time and make it fit their conclusion. Sturm's basing his criteria with SuperBowl I is appropriate since this is what many considered the modern era of Football. Does anyone even care about the pre SB era except old die hards? And over the last 20 years, Dallas would still be on top based on their wins in 1992,93 and 95. Perhaps NE could match that.
ReplyDeleteActually, the helmets are spot on, excpet the jags...
ReplyDelete